Economic Environment
The Federal Home Loan Banks ended 2025 in a position of strength. Economic uncertainty prevailed throughout the year, spurred on in part by the longest government shutdown in history in the fourth quarter. Despite three interest rate cuts by the Federal Reserve in the fall,[1],[2], gross domestic product underperformed, falling below the 10-year and long-run average. Yet, in the face of these economic headwinds, the FHLBanks continued to deliver access to the reliable liquidity that has been a hallmark of the System for nearly 94 years, and ended the year with a solid foundation of capital for the years ahead.
Figure 1 shows that the U.S. started 2025 with negative Real GDP growth – the first negative quarterly growth since the first quarter of 2022. While GDP growth accelerated in the second and third quarters, fourth quarter growth was restrained by the government shutdown that began in October.
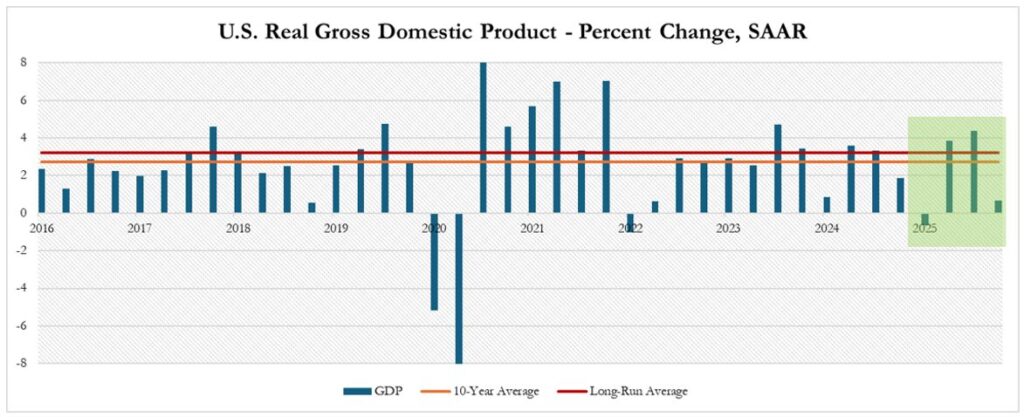
Figure 1: U.S. Real GDP 2016-2025[3]
FHLBank Liquidity
The liquidity provided by the FHLBanks supports growth when demand rises and delivers countercyclical stability when the economy slows, helping to offset liquidity contractions that could otherwise deepen downturns. As shown in Table 1, at the end of 2025 the FHLBanks provided nearly $1 trillion in liquidity support to their members and the communities they serve. While total advances outstanding were slightly lower at the end of 2025, utilization remained high, with more than half of FHLBank members using advances to meet their funding needs. Figure 2 shows that collateralized borrowing from the FHLBanks was used by an average of 3,475 members each quarter from 2019 to 2025.[4] The high utilization is not surprising as the FHLBanks are member owned cooperatives, designed to meet the changing needs of their members. A survey by the American Bankers Association (ABA), published in March 2026, found that FHLBank advances are the clear first choice for collateralized borrowing, by a wide margin (Figure 3).[5] ABA’s survey results indicate that FHLBank liquidity supports increased lending by their members across key segments, including single-family and multifamily mortgages, land acquisition and development, and community and economic development credit.
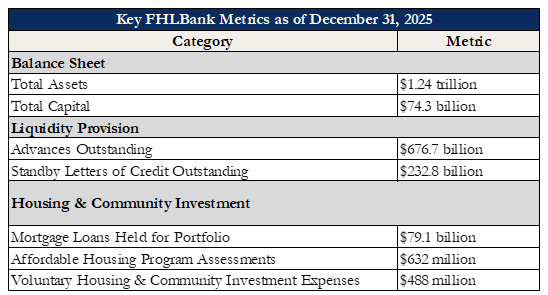
Table 1: 2025 FHLBank Financial Highlights
Along with continuing to serve as a reliable source of liquidity, 2025 marked the second year in a row in which the FHLBanks contributed more than $1 billion from their earnings to support their housing and community investment programs. Affordable Housing Program (AHP) awards in 2025 included $638 million in competitive affordable housing grants and $257 million in AHP set-aside program funding to increase homeownership. Together, the AHP awards supported approximately 43,000 housing units.[6] In addition to the AHP awards, the FHLBanks contributed $507 million to support additional AHP awards and for their voluntary programs—the FHLBanks operate more than 60 unique voluntary programs across the 11 FHLBank districts.[7]
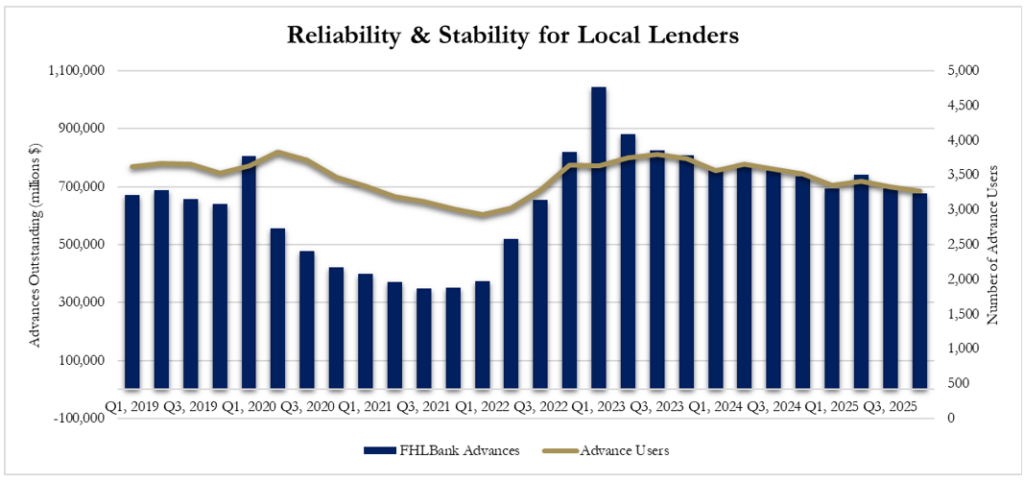 Figure 2: FHLBank Total Assets and Advance Utilization
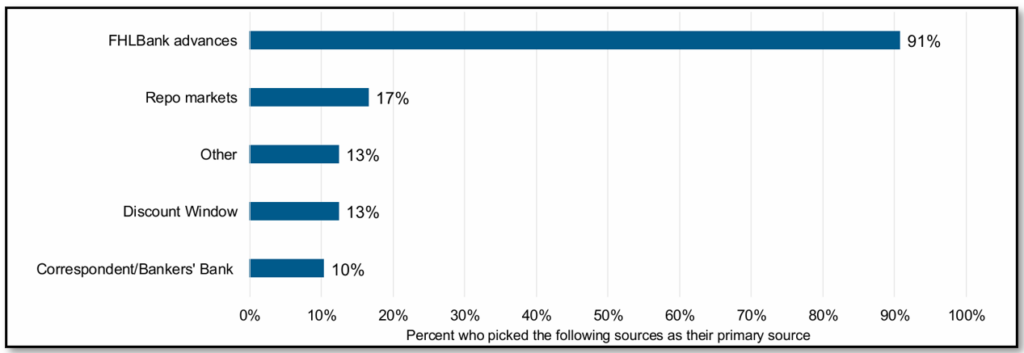 Figure 3: ABA Survey,
“Preferred Source of Collateralized Borrowing for Daily or Routine Liquidity”
Figure 3: ABA Survey,
“Preferred Source of Collateralized Borrowing for Daily or Routine Liquidity”
Capital Strength
Net Income declined in 2025 in tandem with lower advance volumes over the course of the year (Figure 2). Advances are the primary collateralized lending vehicle offered by the FHLBanks, thus higher advance volumes generate higher income, and lower advance volumes generate lower income. Empirically, this relationship is strong, with advances and net income exhibiting a correlation coefficient above 0.8. But, while net income and advances declined, voluntary housing and community investment expenses increased, as did total capital, retained earnings, and the FHLBanks regulatory capital-to-assets ratio, shown Figure 4. These increases represent an investment in the future to ensure the FHLBanks are positioned to serve their members and their communities in any economic environment. In times of heightened uncertainty, the FHLBanks strengthened their capital buffers to provide confidence and assurance to members and the U.S. financial system that they will be there when they are needed, as they have been for nearly 100 years. At the end of 2025, the FHLBanks’ regulatory capital-to-assets ratio was the highest year-end level since 2021, reflecting the prudent risk management practices of executive teams across the System.[8]
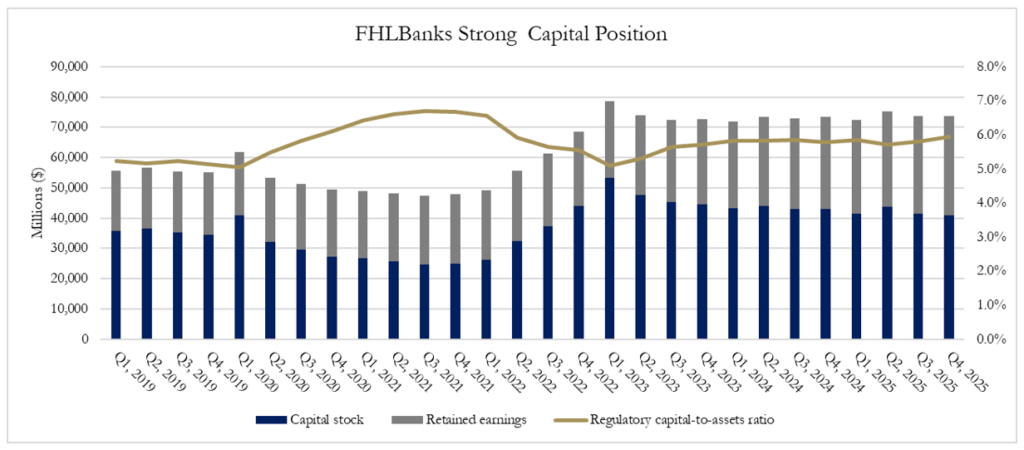 Figure 4: FHLBank Capital Stock and Regulatory Ratio
Top 10 Advance Borrowers
Each quarter, the FHLBanks Combined Financial Report lists the Top 10 Advance Holding Borrowers. This disclosure helps stakeholders assess and understand who the top users are and monitor advance concentrations. Figure 5 shows the dollar value and percentage share represented by the Top 10 Advance Holding Borrowers over the last decade. The Figure shows the percentage share of advances attributable to the top 10 borrowers reached a low point over the past decade at the end of 2025. While the dollar value of the top 10 users was not at an absolute low point in 2025, due to the unusually low advance levels in 2020 and 2021 when the U.S. financial system was flush with Covid stimulus relief funds, if those two anomalous years are excluded, 2025 was also a dollar value low point for the top 10 advance users over the past decade. Thus, at the end of 2025, a greater percentage share of advances, Systemwide, was going to and being utilized by a broader range of members, reflecting the breadth of advance utilization and the ABA survey finding that FHLBank advances are the most preferred source of collateralized borrowing by community, regional, and large national banks.[9]
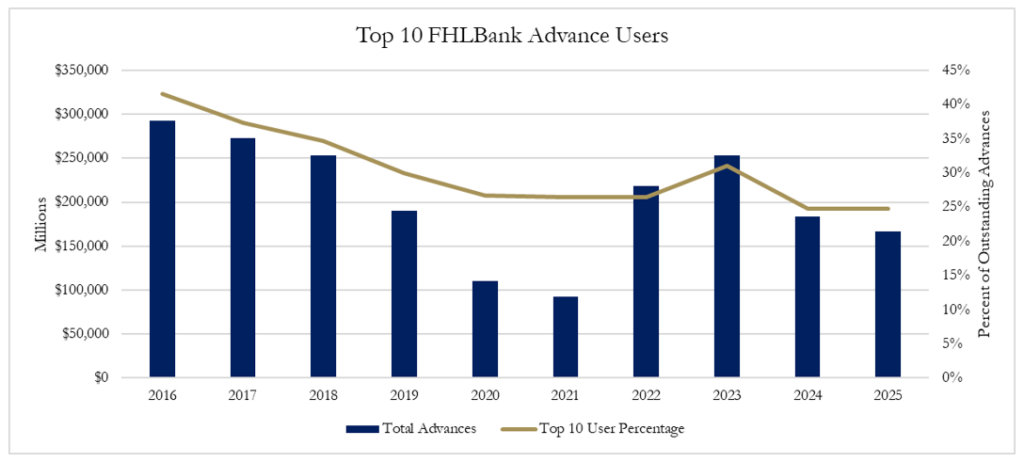
Figure 5: FHLBank Top 10 Borrowers 2016-2025[10]
Figure 6 provides a deeper dive into the Top 10 Advance Holding Borrowers at the end of each calendar year from 2016 to 2025. Darker shading indicates a higher ranking (e.g., 1, 2, 3) and lighter shading indicates a lower ranking (e.g., 8, 9, 10). The top 10 advance users in each of the past 10 years (100 total entries) include banks (77), insurance companies (18), and credit unions (5). The figure shows 23 unique members over the 10-year period, consistent with expectations that larger institutions tend to be repeat, high dollar value advance users. Of these, six appear eight to 10 times (high-frequency users), eight appear three to seven times (regular users), and the remaining nine appear once or twice. The takeaway is that the FHLBanks provide consistency to members with access to collateralized borrowing, and larger member institutions provide consistency to the FHLBanks and to capital markets as consistent users of FHLBank liquidity. The FHLBanks provide stable core liquidity for large members and collateralized borrowing as needed to a rotating set of episodic participants. While the percentage share of the top 10 Advance Holding Borrowers has declined over time, it is important to recognize the support these users provide to the FHLBanks. Advances are the FHLBanks’ primary source of income, and the largest borrowing members provide a stable, consistent foundation for that revenue. This core usage supports the System’s operations, housing and community investment programs, and the broader suite of member services. In this way, the largest users—across banks, credit unions, and insurance companies—play a critical role in sustaining the capacity of the FHLBanks to serve smaller, community-based lenders. As privately capitalized, member-owned cooperatives, the strength of the FHLBank System is grounded in the collective strength of its members—large and small—with its largest advance users playing a vital role in sustaining the reliable liquidity that supports members and the communities they serve.
Figure 6: FHLBank Top 10 Borrowers 2016-2025[11]
[1] The federal government shutdown from October 1, 2025, to November 13, 2025, was the longest U.S. federal government shutdown on record.
[2] https://www.federalreserve.gov/monetarypolicy/fomccalendars.htm
[3] https://fred.stlouisfed.org/series/GDPC1
[4] https://www.fhlb-of.com/ofweb_userWeb/resources/2025Q4CFR.pdf
[5] https://bankingjournal.aba.com/2026/03/aba-databank-inside-bank-decision-making-on-liquidity-and-contingent-funding/
[6] https://www.fhlb-of.com/ofweb_userWeb/resources/2025Q4CFR.pdf
[7] https://fhlbanks.com/impact-report/
[8] https://www.fhlb-of.com/ofweb_userWeb/resources/2025Q4CFR.pdf
[9] https://bankingjournal.aba.com/2026/03/aba-databank-inside-bank-decision-making-on-liquidity-and-contingent-funding/
[10] https://www.fhlb-of.com/ofweb_userWeb/resources/2025Q4CFR.pdf (note, data from Q4 CFRs 2016-2025)
[11] https://www.fhlb-of.com/ofweb_userWeb/resources/2025Q4CFR.pdf (note, data from Q4 CFRs 2016-2025)